
This Book Review of Why Stocks Go Up and Down by William Pike and Patrick Gregory is brought to you from Kendall King from the Titans of Investing.
Genre: Bonds Investing
Author: William Pike and Patrick Gregory
Title: William Pike and Patrick Gregory (Buy the Book)
Summary:
Why Stocks Go Up and Down, by William Pike and Patrick Gregory, attempts to convey the fundamental knowledge that new investors need in order to understand stock price behavior.
Both authors believe many investing books try to communicate wisdom without first providing adequate knowledge. They argue that before you can begin to evaluate stock price behavior, you must first understand how a company is born, how it raises money to grow, and how it uses its assets to generate cash flow.
Although the book is geared towards readers with little or no background in investing, it is certain to add value for experienced investors. It is divided into four parts, which are summarized below.
Part 1 – Basics: Starting a Business, Financial Statements, and Common Stock
This section of the book takes the reader through the formation of a fictional company. It details common accounting principles and notes the differences between a company’s balance sheet and income statement. It explains how a company can raise equity capital by issuing stock and ends with the company going public.
Part 2 – Securities Other Than Common Stock: Bonds, Preferred Stock, and Hybrid Securities
The authors explain that most companies are financed through a combination of equity (stock) and debt (bonds and bank loans). Bond fundamentals are presented, along with an overview of preferred stock and other hybrid securities. Pike and Patrick provide insight about times in which companies may choose to use each.
Part 3 – Company Assets and Cash Flow
This section defines fixed assets and presents details about how companies depreciate the value of these assets over time and its effects on earnings. An overview of a cash flow statement is presented and free cash flow is defined, along with its importance to stock price behavior.
Part 4 – Why Stocks Go Up (and Down)
This final section presents several common stock valuation metrics in an attempt to quantify when stocks are undervalued, and thus represent a buying opportunity. A working explanation of why stocks go up and down is presented and includes the key idea that the stock market anticipates future events.
Introduction
Why Stocks Go Up and Down, by William Pike and Patrick Gregory, aims to teach the fundamental knowledge all investors seek to be successful. It poses that most other investing books try to express wisdom without first conveying adequate knowledge, which has led to the book being heralded as “the book you need to understand other investment books.”
It is broken into four parts:
- The formation of a business, introduction to financial statements, and common stock
- Introduction to methods other than common stock that companies use to raise money
- Discussion of company assets and cash flow
- A working explanation of why stocks go up and down
The authors believe that one cannot attempt to understand stock price behavior without first grasping how a business begins, raises money, and uses funds.
Part 1 – Basics: Starting a Business, Financial Statements, and Common Stock
Starting a Business
The book begins with the fictional story of Mr. Jones starting a mousetrap company (JMC). His trusted friend and accountant, Mr. Greenshades, agrees to help him with the process. He explains that JMC is currently a sole proprietorship, which simply means Mr. Jones owns the whole company.
He advises Jones to keep accounting records in the same manner as most other companies, urging Jones to possess the two primary financial statements: a balance sheet and an income statement.
The balance sheet reflects the financial condition of the company at a given point in time and has 3 major categories:
- Assets – anything of value that the company owns or has claim to
- Liabilities – debts the company owes
- Owner’s Equity – the combination of the amount of money put into the company by the owners and any retained earnings
As the name implies, the balance sheet must completely balance out, with the sum of the liabilities and owner’s equity equaling the assets. The income statement shows the revenue (sales) the company has made, the expenses that have been incurred to make those sales, and the profit or loss that results over a specific period of time. The income statement is commonly referred to as a profit and loss or ‘P&L’ statement.
Ownership and Stock
Business is going well and Jones wants to expand his company by buying some land and building a small factory.
At this point, JMC doesn’t have much cash or many assets. This means a bank is unlikely to loan JMC the money he needs, simply because it is too risky. Since Jones also does not want to put any more of his own money into the company, Greenshades suggests that he raise equity capital.
He explains that equity capital is money that is permanently put into a company in exchange for a portion of ownership. Unlike bank loans or bonds, this money never has to be repaid.
Four of Jones’ friends have faith in him and agree to contribute the money needed for the new factory in exchange for 40% of the company (10% each). As equity investors, they are willing to risk their capital because they know that if JMC is profitable, they can recoup their investment and more through dividend payments.
Dividends are one way companies share a percentage of earnings with investors.
Furthermore, these investors hope the value of their share in the company will appreciate over time and can be sold for much more than they contributed.
Greenshades explains that stock can be used to reflect ownership of a company. They decide to create 100 shares of stock, of which Jones will retain 60 shares, and each investor will receive 10 shares. The number of shares is purely arbitrary; it could have been 10 or 1000 as long as the percentages were the same.
Additionally, since there are now 5 investors, JMC is no longer a sole proprietorship and needs to be converted to either a corporation or a partnership.
He explains that a corporation is a legal entity, separate from the owners of the company.
The primary advantage of a corporation is the limited liability of the owners, which means they cannot be held personally responsible for the debt of the company. This differs from the liability agreements under both sole proprietorships and partnerships, which require owners to use their personal funds to settle any debt the company fails to pay.
They agree to incorporate and change the name to JMC Inc.
Greenshades explains they are now all shareholders and therefore entitled to certain rights. These include receiving the company’s annual report, attending stockholders’ meetings, and voting on issues raised at the stockholders’ meetings.
These rights are the same for anyone owning stock in larger corporations such as Apple or Disney, except that these companies have millions of shares and no one person typically owns more than 1- 2% , while many own much less. These larger corporations also have a board of directors, who are elected by stockholders and represent their interests.
Ratios Investors Watch
In order to see how well a company is doing, investors often look to their annual report, where information is released about the company’s business outlook and finances. While these reports can appear very intimidating, they are one of the main sources of information for investors.
The authors state that,
“When a financial analyst first looks at balance sheets or income statements, all they see is the same morass of numbers that the layman sees. To make sense of these figures, to evaluate a company’s financial strength or weakness, and to get insights into possible stock market performance, a financial analyst must look at relationships between these figures.”
Pike and Gregory, 41
These ratios can be broken down into five groups:
- Stock Evaluation – Describe what value you are getting at a certain stock price
- Profitability – Measures of management effectiveness
- Debt and Interest – Quantify the level of debt a company has to determine its relative risk and ability to raise more money if needed
- Liquidity or Financial Condition – Measure of ability to pay off debt in the short term
- Efficiency – Describe how well the company manages specific assets like inventory
By comparing these ratios to those of other similar companies, one can better evaluate a company’s performance and gain insights into stock movements.
Going Pubic – Primary and Secondary Offerings
There are two main reasons why a company may want to go public.
- The company wishes to raise capital and does not want to borrow or have another private offering. This results in the company writing new shares and selling them to investors.
- Existing stockholders in a private company want to sell stock and raise money for themselves.
In either case, the company must register the shares they wish to sell with the Securities and Exchange Commission (SEC) and disclose certain financial information so that prospective investors may evaluate the company.
Whenever a company sells new stock, this is referred to as a primary offering. The first time that a company registers shares of stock and sells them to the public is called its initial public offering (IPO).
When existing shareholders sell their already outstanding stock, whether to the public or other private investors, it is called a secondary offering. Technically, every transaction made on the New York Stock Exchange or the Nasdaq is a secondary offering, but they are usually just called trades.
Earnings – JMC Goes Public
JMC Inc. has been steadily growing and currently has 12 investors and a total of 500 shares of outstanding stock. It is still a private company and Jones wants to raise money to build a second factory in order to continue growth.
He explored the possibility of receiving a loan, but the bank said his debt and interest ratios were, again, too risky for them to lend. Greenshades suggests that they take the company public and that Jones should contact an investment bank. Investment banks have nothing to do with banking as we usually refer to it.
Instead, they help companies raise money by serving as the bridge between businesses that wish to sell stock or bonds, and members of the public or institutions that wish to buy. Jones contacts Mr. Gaines, who is an investment banker with experience taking similar companies public.
Since JMC is planning to launch an IPO, some of the current shareholders decide to sell some of their own shares as a secondary offering along with the primary offering.
Gaines tells Jones the price of a stock is related to how well a company has been doing in the past and how well it is expected to do in the future. He believes that given the expected growth rate of the company and the market outlook, the stock should sell at a price-to-earnings (P/E) ratio between 10x and 12x.
This means that if JMC was expected to earn $2 per share this year, new stock should sell between $20 and $24 per share.
Gaines also points out that JMC wants to sell its shares at the maximum possible price for two reasons:
- To maximize value for the selling stockholders
- To ensure the company can raise the necessary funds selling as few shares as possible
This ensures the current owners suffer the smallest dilution.
Dilution occurs when outstanding shares of a company’s stock lose value as a result of the company issuing more shares.
It is equivalent to cutting the same pie (earnings) into more pieces (stock). Issuing new stock at the maximum possible P/E ratio results in the smallest amount of dilution, however if the asked price is too high, people will be reluctant to buy. It is here that “we see the two sides of the capitalism ‘coin.’ On one side are investors who wish to invest their capital (money) where they see the fastest growth.
On the other side are the companies that wish to raise capital. The result is that the companies with the most successful products (i.e., what consumers want) have the easiest (cheapest) ability to raise money and increase production of these products” (Pike and Gregory, 82). Jones agrees to work with Gaines, who charges a small commission for each share sold, and JMC Inc. is taken public.
Part 2 – Securities Other Than Common Stock: Bonds, Preferred Stock, and Hybrid Securities
Most companies are financed through a combination of equity (stock) and debt (bonds and bank loans). Whether a company chooses to finance through equity or debt at a particular time depends on their current valuation, debt and interest ratios, and market conditions.
In general, companies are more likely to raise equity capital when they have a high P/E ratio because this will reduce the effect of dilution and improve their debt ratios.
If a company has a relatively low P/E ratio and their debt ratios are reasonable, they are more likely to raise money through the sale of bonds. Companies should raise money in whichever way will lead to the highest expected increase in earnings per share. This section presents methods other than common stock that companies use to raise capital.
Bonds
A bond is a contract between a company that is borrowing money and people or institutions who are lending money. They are generally sold at a face value of $1,000 with a set interest payment (called coupon) and maturity date (date when the $1,000 principal must be paid back).
A bond’s coupon yield is defined as the total annual coupon divided by the face value. Coupon payments are typically made semiannually (twice a year), but can be quarterly, monthly, or yearly.
Unlike stocks, bonds are generally backed by a specific asset or group of assets, which means if the company is unable to pay back the principal or interest obligations and goes bankrupt, the assets will be sold and cash will be distributed to the bond holders first.
After being sold to the original owners, bonds are often resold on the secondary market.
When a $1,000 face value bond is selling at more than par ($1,000), we say it is selling at a premium. Similarly, if it is selling at less than par, we say it is selling at a discount. It is important to note that as the price of the bond increases, the coupon is a smaller and smaller portion of the price and the current yield (coupon divided by current price) of the bond decreases.
Bondholders are concerned with safety, defined as the probability of all future interest and maturity payments being made on time. While many investors analyze companies’ financial statements on their own, there are several agencies that rate the creditworthiness of a company.
These ratings range from AAA and AA, which are considered very safe, all the way down to C and D ratings, which reflect bonds that have missed payments.
Bonds rated BBB or better are considered investment grade, while those rated below are called high-yield or “junk” bonds. This is due to their significantly higher likelihood of default and limited liquidity (ability to buy/sell easily).
Bond yields are inversely related to their credit ratings, which simply implies that investors require a higher coupon to take on the added risk of buying lower rated bonds.
Why Bonds Go Up and Down
Bond prices on the secondary market are driven by two main factors:
- Changing interest rates Interest rates are generally driven by governmental policy. As interest rates rise in the economy as a whole, the coupon of new bonds will increase. This causes investors to sell their old bonds, which drives the price down (and yield up) until the yields of similarly rated bonds are about the same. The inverse is true for declining interest rates.
- Changes in creditworthiness Bond prices are also sensitive to changes in credit quality, but in a much more subjective manner than changing interest rates. If a bond issuer’s creditworthiness is deteriorating, investors will sell the bond until the price has been driven down enough that the increase in yield offsets the increase in risk. For instance, if a previously AA rated company was being downgraded to A, the price of its outstanding bonds would likely drop until the yield was similar to that of other A rated bonds in the market.
Convertible Bonds
Convertible bonds are just like regular bonds, except they may be converted into stock at some point in the future at a specified conversion rate (number of shares / bond). This feature can provide unique advantages for investors as well as companies.
Convertible bond prices move differently than those of normal bonds.
If the converted value (conversion rate x stock price) is greater than the current market value of the bond alone, the convertible bond price is likely to move up in line with the underlying common stock price.
However, if the price of the stock drops far below the conversion price (face value / conversion rate), the bond is unlikely to follow the stock down below the level of other similarly rated bonds with comparable yields. This offers investors an opportunity to gain the upside potential of an increasing stock price while limiting their downside risk.
There are also advantages for the issuing company.
First, they will likely be able to sell the bond at a lower yield than that of other similarly rated companies because of to the immense upside potential for investors. Additionally, if a bond is converted to stock, the company no longer has to make the interest or principal payments associated with it.
However, one of the major disadvantages to the company is that this increases the shares of stock outstanding. This effectively dilutes the ownership of other stockholders, and decreases earnings per share (as discussed in Part 1).
Preferred and Convertible Preferred Stock
Preferred stock is equity that is sold with a fixed dividend, similar to the coupon on a bond. Preference stock, as it is often called, may or may not have a set life span and is also rated by credit agencies in the same manner as bonds.
At first glance, it may seem more like a bond than common stock. Despite their similarities, there are two key differences between preferred stock and bonds.
First, the dividend on preferred stock is not a contractual obligation as it is on a bond. Second, the interest (coupon) payments on bonds are expenses, which get deducted from sales before taxes are assessed, while preferred stock dividends are paid from after tax profits.
It is this characteristic that classifies preferred stock as equity and highlights its lack of a tax benefit that bonds have.
The major difference between preferred stock and common stock is in the consistency of the dividend. The common stock dividend is paid at the discretion of the board of directors and may fluctuate widely, whereas most preferred stocks pay a fixed dividend that is set at the time of issuance.
Although the preferred dividend is not technically a contractual obligation, it is expected and any missed payment severely hurts a company’s reputation (rating) and inhibits future borrowing.
Companies often issue preferred stock when they have a low P/E ratio (which makes selling stock unattractive) and poor debt and interest ratios (that make issuing bonds or borrowing from a bank difficult). Other corporations and tax-free accounts, such as IRA’s are the largest holder of preferred stock due to the dividends received deduction, which provides a large tax deduction on dividend income from preferred stock.
Part 3 – Company Assets and Cash Flow
The authors admit that, “the topics covered in this chapter are not the kind of things that are generally heard in investment discussions at cocktail parties,” and may seem more like accounting issues than investment concerns, but argue that, “an informed investor must know when something is simply an accounting detail and when it has an impact on company earnings, and hence, investment results” (Pike and Gregory, 211).
Fixed Assets and Depreciation A company’s fixed assets typically include any property, plants, and equipment, which together are often referred to as PP&E. These assets are shown on the balance sheet at their initial cost, although we know plant and equipment wear over time.
We account for this by depreciating the value of these assets over their expected useful life.
On the balance sheet, we show the original cost of the assets as the gross PP&E and subtract the accumulated depreciation to obtain the net PP&E. Depreciation is also accounted for on the income statement for a given year, but only the amount occurring in that year.
Depreciation is considered a non-cash expense since there is no cash outflow and we are simply writing down the value of the asset.
There are several types of depreciation, with the most common methods being straight-line and accelerated. Straight-line depreciation reduces the value of an asset by an equal amount each year of its useful life, whereas accelerated depreciation reduces the value more in the early years and less towards the end of an asset’s life.
The most important point is that an investor should always watch for changes in a company’s depreciation expenses to see what impact it might have on future earnings. In addition, investors must be alert to the fact that companies can sometimes change their method of depreciation to mask a year of lower than expected earnings.
Cash Flow
In addition to the balance sheet and income statement, most companies provide a statement of cash flow in their annual reports.
This statement is generally broken into three categories:
- Cash flow from operations
- Cash flow from financing
- Cash flow from investing
Cash Flow from Operations
Cash flow from operations is the most important source of cash, and refers to cash that:
“flows into the company from selling its products or services, less the cash that flows out to pay for raw materials, wages, and other expenses necessary to run the company on a day-to-day basis.”
Pike and Gregory, 255
It is important to note that cash flow from operations is not the same as earnings. This is because depreciation and several other non-cash expenses are subtracted from sales when calculating earnings, but are not subtracted when calculating cash flow.
Thus, the easiest way to calculate cash flow from operations is to take earnings and add back any non-cash expenses.
Cash Flow from Financing
Inflow from financing occurs from a company raising new money by issuing equity securities (common or preferred stock) or by borrowing (bank loans or bonds).
Outflows occur from the repayment of principal debt amounts, the payment of both common and preferred dividends, and money spent to repurchase stock. Interest is not considered to be an outflow from financing, and is accounted for in cash flow from operations since it is paid on a regular basis.
Cash Flow from Investing
Cash flow from investing generally refers to cash a company spends to improve its business. It usually does not mean buying stock and bonds, although these would be included.
From the perspective of a company, investing typically means buying new plant and equipment so that products can be made faster, better, or cheaper.
These are called capital expenditures.
Outflow from investing, then, includes capital expenditures as well as cash spent buying other companies (wholly, or partially through stock). Inflows include any money received for the sale of a company or any of its property, plant, and equipment.
Survival Needs and Free Cash Flow
A company’s survival needs include debt principal repayment requirements, maintenance level capital spending (replacing worn out and obsolete machinery), and preferred dividends. These are payments that a company must make in order to stay in business.
If a company’s cash flow from operations is not enough to meet these minimal needs, the company’s stock is probably not a good investment unless there is a compelling reason to believe that it will only be short on cash for a year or two, and can finance itself in the meantime.
We call the cash flow from operations that is leftover after the survival needs have been met free cash flow (FCF); this is used to increase shareholder value.
This can be done by increasing capital spending above the maintenance level, increasing the common dividend, repurchasing company bonds or prepaying debt, hoarding cash, or repurchasing common stock, to name a few. It is up to management to determine to the best way to use free cash flow to maximize shareholder value and a stock’s price often reflects how effectively management uses its FCF.
Part 4 – Why Stocks Go Up (and Down)
“Ask a professional investor why stocks go up and down, and you will be told that each situation is different. That statement is probably correct, but it is not very useful.”
Pike and Gregory, 291
This section of the book aims to provide a universal framework for understanding and evaluating stock price behavior.
When is a Stock Cheap or Expensive?
Stock prices are related to a company’s long-term growth potential and its ability to generate free cash flow. Free cash flow can then be returned to investors in the form of dividends or reinvested in the company to increase future earnings. In general, small, rapidly growing companies will choose to reinvest their free cash and more mature companies will return at least a portion to investors in the form of a dividend.
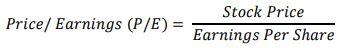
The Price-to-Earnings Ratio
There are several ratios that investors look at to determine whether a stock is cheap or expensive, the most common being the Price-to-Earnings ratio. It is defined as the stock price divided by the earnings per share, as shown below.
The P/E can be calculated using past (trailing) or estimated future (forward) earnings. Investment banks such as Morgan Stanley, Goldman Sachs, and others employ analysts to follow stocks and issue future earnings estimates on the companies they follow.
These are then aggregated by data providers who publish a consensus estimate of earnings per share (EPS) for many different companies. Forecasted earnings should be used when looking at P/E ratios because the stock market anticipates.
This means:
“the price of a stock reflects investors’ expectations of future performance.”
Pike and Gregory, 295
Companies with greater growth potential and whose earnings can be predicted easily will generally trade at a higher P/E ratio. So what is a ‘high’ or ‘low’ P/E ratio?
The book states there is no such thing as a correct P/E ratio, but there are three ways to help determine an appropriate level:
- Historical Analysis,
- Comparison to Peers, and
- Comparison to Market.
Historical Analysis
When evaluating a company’s stock, a good place to start is to compare the current P/E ratio to the historical range. This gives an idea of what a reasonable P/E multiple is for the stock going forward, assuming a similar level of growth is expected.
In addition, the range allows us to quantify the potential upside and downside of an investment.
Let us look at the example below for Diversified Manufacturing Inc. (DMI) at a price of $27 in December 2014.
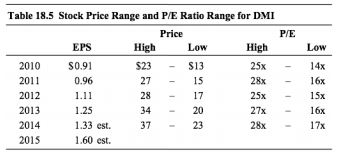
It can be seen that the P/E ratio fluctuates widely throughout each year, reaching an average low of 15 and a high of at least 25. At the current price of $27 and 2015 estimated EPS of $1.60, DMI is selling at a P/E of 16.9x 2015 earnings and appears ‘low’. Unless the market is depressed in 2015 or there is some new development in the company outlook, it is possible that the stock will reach a P/E of 25 sometime throughout year, which translates to a stock price of $40 and a 48% gain.
On the other hand, it is also possible that the stock will drop to a P/E of 15 and a price of $24 at some point in the year, which corresponds to an 11% loss.
At the current price, there exists a reward/risk ratio of 48% / 11%, or about 4:1, and that the stock appears undervalued. Although this is an extreme example, as P/E ratios do not typically fluctuate this widely, it illustrates the concept well. Investors may increase their upside potential and mitigate their downside risk by buying a stock when it is selling at the low end of its P/E range.
However, the historical range can only be considered reasonable for the future if the growth rate of earnings is expected to be about the same, nothing has changed in the company or industry to affect an investor’s confidence in his earnings estimates, and the whole market’s evaluation of P/E’s has not changed.
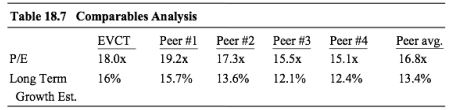
Here, if we simply use the P/E ratio it appears EVCT is overvalued to its peers, but this would be a naive conclusion since it has a higher expected growth rate. This is why some growth investors argue that the most expensive (highest P/E) stocks are often the best investments. It becomes apparent that the P/E ratio is not sufficient to compare peers because they are all growing at different rates.
Therefore, we introduce the concept of the price/earnings-to-growth (or PEG) ratio which is calculated by dividing the P/E multiple by the expected growth rate.
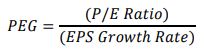
Expected long-term growth rates are published by investment banks and a consensus value can be found online. When we calculate the PEG ratio for these companies, EVCT at 1.13 is lower than the average of 1.26.
This indicates that while EVCT trades at a higher P/E multiple, it may still be undervalued due to its faster expected growth rate. This analysis assumes that the companies being compared have equivalent levels of risk, which is not always the case.
Comparison to Market
The third way to use the P/E ratio is to compare it to the P/E of the market as a whole. This is called a relative multiple and is calculated by dividing the P/E multiple of a company by the P/E of a readily available index, most commonly the S&P 500.
A relative multiple of greater than one signals that the stock is trading at a premium to the market, while a multiple of less than one signals a relative discount. In order to put this number in perspective, we could look at the historical range as we did with the P/E ratio and compare the growth rate of the company to the market as a whole.
Overall, the P/E ratio is not a perfect valuation metric, but it is the most common tool that investors use to evaluate companies. It is important to note that we have only considered the P/E to be related to the earnings growth rate whereas in actuality there are many other factors (both quantitative and subjective) that contribute. This is a good fundamental start.
Other Valuation Metrics
While not as widely used as the P/E ratio, a stock may also be valued using the Price-to-Cash-Flow Ratio. Cash flow in this context is typically defined as cash flow from operations. Free cash flow may also be used, but is much more volatile and can change a lot from year-to-year. In either case, the Price-to-Cash-Flow ratio is calculated by dividing the stock price by the cash flow per share.
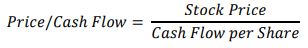
The Price-to-Cash-Flow ratio can be used to value a company in the same ways that the P/E is used: by drawing analogies to history, peers, and the market as a whole.
There are several scenarios when this is the advantageous statistic.
It is commonly used when a company is losing money, just breaking even, or only making a small profit.
In these cases, the P/E ratio would be meaningless because the company has little or no earnings. Additionally, it should be used whenever a company has a large depreciation or deferred tax figure that causes the net earnings to look low compared to the cash flow, or when comparing two or more companies that use different depreciation accounting methods.
The Price-to-Sales (P/S) Ratio may also be used as an alternative to the P/E ratio. It is calculated by dividing the market capitalization (stock price x number of shares) by the projected sales.

This is often applied to rapidly growing companies early in their life cycle, when high development and manufacturing costs lead to minimal or negative earnings and cash flow. Just as with a low P/E or low Price/Cash flow ratio, a low P/S ratio compared to peers may signal that a stock is undervalued, assuming similar growth rates.
The P/S ratio may also be divided by the expected growth rate for a normalized comparison.
Another valuation tool that is frequently used by investors is the Enterprise Value-to-EBITDA ratio. Enterprise Value (EV) represents what a company may be worth to a potential buyer and is defined as follows:

Debt is added to the market cap because if an investor bought a company, he would become responsible for the debt of that company. Similarly, cash is subtracted because the investor could pay himself the cash as a dividend and effectively reduce the cost of the company.
EBITDA, is Earnings Before Interest, Taxes, Depreciation, and Amortization.
The EV/EBITDA ratio is essentially a measure of the value of the company divided by what it can earn for all its security holders (stock and bond holders). This is in contrast to the P/E ratio, which only considers what a company can earn for its stockholders. The EV/EBITDA is most often used to compare peers, with a low ratio signaling a possible undervaluation.
A thorough investment analysis requires the use of all these valuation tools as well as consideration of the ratios presented in Part 1. Whichever metrics are used, the risk/reward ratio can be tilted in an investor’s favor by buying when he considers a stock to be undervalued when compared to its own history, its peers, and the market as a whole.
After a stock is bought, it is essential to revise one’s analysis as new information surfaces.
Eventually, it may reach a point of overvaluation and should be sold. It is important to note that these measures assume the market is generally efficient, which means wide discrepancies between a company’s intrinsic (true) value and stock price either do not exist or cannot be accurately quantified.
Why Stocks Go Up and Down
With our understanding of business fundamentals, valuation ratios, and remembering that stock prices anticipate future events, the book attempts to present a working explanation of why stocks go up and down.
- Stocks go up and down in response to changes in perception of a company’s ability to generate earnings and pay dividends, both in this year and the future
- Changes in perception can arise from developments within the company, in the company’s competitive environment, or in the economy in general” (Pike and Gregory, 333).
Notice that this explanation does not attempt to explain why a stock sells at a certain price, which is a fundamentally more difficult question than whether it will move up or down from its current level.
The authors note that there is no substitute for experience and that new investors should choose a group of stocks to watch daily and stay tuned in to all the news about those companies. Watching whether or not prices respond to news developments over a period of time will help you develop an awareness of:
- What expectations are reflected in a stock’s price
- Which information will likely impact future earnings
- What the current sentiment of the market is toward the company and industry it operates in
After a period of time you will find yourself becoming sensitized to which factors are important and which are less meaningful.
At that point, you will be able to determine why stocks go up and down.
Britt always taught us Titans that Wisdom is Cheap, and principal can find treasure troves of the good stuff in books. We hope only will also express their thanks to the Titans if the book review brought wisdom into their lives.